Observability
Introduction
Note
You will not install a full blown monitoring and logging solution on the development cluster such as Prometheus and Loki, but will do so for the staging and production clusters.
On the development environment you will be configuring the Kubernetes Metrics Server and Kubernetes Dashboard tools. This way your cluster size can be small but sufficient that you can do your local development and deploy that to a Kubernetes cluster and test it. At the most basic level you will need to be able to troubleshoot your aplication if things go wrong. In this section, you will learn about the Kubernetes Metrics Server and the Kubernetes Dashboard. Metrics Server is a scalable, efficient source of container resource metrics for Kubernetes built-in autoscaling pipelines. It collects resource metrics from Kubelets and exposes them in Kubernetes apiserver through Metrics API. Kubernetes Dashboard is a general purpose, web-based UI for Kubernetes clusters. It allows users to manage applications running in the cluster and troubleshoot them, as well as manage the cluster itself.
Prerequisites
To complete this section you will need:
- Helm installed as explained in the Installing required tools section.
- A Kubernetes cluster (DOKS) up and running as explained in the Set up DOKS section.
- JQ command-line JSON processor installed on your machine.
- The online boutique sample application deployed to your cluster as explained in the Tilt remote development section.
Installing the Kubernetes Metrics Server
In this section you will install the community maintained Kubernetes Metrics Server. Please follow below steps to install it using Helm:
-
Add the Metrics Server
Helmrepository: -
Install the
Kubernetes Metrics ServerusingHelm:helm upgrade --install metrics-server metrics-server/metrics-server \ --namespace metrics-server \ --create-namespaceNote
To check if the installation was successful, run the
helm ls -n metrics-servercommand, and confirm the deployment status.
Collect resource metrics from Kubernetes objects
Resource metrics track the utilization and availability of critical resources such as CPU, memory, and storage. Kubernetes provides a Metrics API and a number of command line queries that allow you to retrieve snapshots of resource utilization.
Query the Metrics API to retrieve current metrics from any node or pod (you can find your desired node or pod by running kubectl get nodes or kubectl get pods):
kubectl get --raw /apis/metrics.k8s.io/v1beta1/nodes/<NODE_NAME> | jq

kubectl get --raw /apis/metrics.k8s.io/v1beta1/namespaces/<NAMESPACE>/pods/<POD_NAME> | jq
Info
The Metrics API returns a JSON object, so (optionally) piping the response through jq displays the JSON in a more human-readable format.
Retrieve compact metric snapshots from the Metrics API using kubectl top. The kubectl top command returns current CPU and memory usage for a cluster’s pods or nodes, or for a particular pod or node if specified.
The output should look like the following:
NAME            CPU(cores)   CPU%   MEMORY(bytes)   MEMORY%
basicnp-766qo   280m         7%     1662Mi          24%
basicnp-766qr   252m         6%     1561Mi          23%
Or you can query resource utilization by pod in a particular namespace (you can use the microservices-demo-dev namespace you deployed in the Tilt Remote section):
The output should look like the following:
NAME                                     CPU(cores)   MEMORY(bytes)
cartservice-84758f76f-cl9vm              8m           29Mi
checkoutservice-5d8d8cfd5f-8hbjn         3m           16Mi
currencyservice-5d5f698f87-kh4z8         4m           30Mi
emailservice-f8795cc94-r7hwp             30m          40Mi
frontend-6d45d8cc5d-59fmw                1m           20Mi
paymentservice-995d69494-kcqn2           5m           30Mi
productcatalogservice-556d4f9446-7sqp9   7m           16Mi
recommendationservice-59f78c445b-5487v   40m          40Mi
redis-cart-596c7658c4-lwf8g              3m           7Mi
shippingservice-bfc488696-dkcpz          3m           15Mi
See details about the resources that have been allocated to your nodes, rather than the current resource usage. The kubectl describe command provides a detailed breakdown of a specified pod or node.
The output is quite verbose containing a full breakdown of the node’s workloads, system info, and metadata such as labels and annotations.
Click to expand node describe command output
Name:               basicnp-766qo
Roles:              <none>
Labels:             beta.kubernetes.io/arch=amd64
                    beta.kubernetes.io/instance-type=s-4vcpu-8gb-amd
                    beta.kubernetes.io/os=linux
                    doks.digitalocean.com/node-id=018db650-0dd3-4e23-a387-d386a193456e
                    doks.digitalocean.com/node-pool=basicnp
                    doks.digitalocean.com/node-pool-id=45a15812-c08d-48f0-ae7d-61eb0ddc3e7c
                    doks.digitalocean.com/version=1.24.4-do.0
                    failure-domain.beta.kubernetes.io/region=nyc1
                    kubernetes.io/arch=amd64
                    kubernetes.io/hostname=basicnp-766qo
                    kubernetes.io/os=linux
                    node.kubernetes.io/instance-type=s-4vcpu-8gb-amd
                    region=nyc1
                    topology.kubernetes.io/region=nyc1
                    type=basic
Annotations:        alpha.kubernetes.io/provided-node-ip: 10.116.0.4
                    csi.volume.kubernetes.io/nodeid: {"dobs.csi.digitalocean.com":"318312990"}
                    io.cilium.network.ipv4-cilium-host: 10.244.1.102
                    io.cilium.network.ipv4-health-ip: 10.244.1.76
                    io.cilium.network.ipv4-pod-cidr: 10.244.1.0/25
                    node.alpha.kubernetes.io/ttl: 0
                    volumes.kubernetes.io/controller-managed-attach-detach: true
CreationTimestamp:  Mon, 26 Sep 2022 11:48:39 +0300
Taints:             <none>
Unschedulable:      false
Lease:
HolderIdentity:  basicnp-766qo
AcquireTime:     <unset>
RenewTime:       Wed, 28 Sep 2022 11:31:13 +0300
Conditions:
Type                 Status  LastHeartbeatTime                 LastTransitionTime                Reason                       Message
----                 ------  -----------------                 ------------------                ------                       -------
NetworkUnavailable   False   Mon, 26 Sep 2022 11:50:10 +0300   Mon, 26 Sep 2022 11:50:10 +0300   CiliumIsUp                   Cilium is running on this node
MemoryPressure       False   Wed, 28 Sep 2022 11:26:35 +0300   Mon, 26 Sep 2022 11:48:39 +0300   KubeletHasSufficientMemory   kubelet has sufficient memory available
DiskPressure         False   Wed, 28 Sep 2022 11:26:35 +0300   Mon, 26 Sep 2022 11:48:39 +0300   KubeletHasNoDiskPressure     kubelet has no disk pressure
PIDPressure          False   Wed, 28 Sep 2022 11:26:35 +0300   Mon, 26 Sep 2022 11:48:39 +0300   KubeletHasSufficientPID      kubelet has sufficient PID available
Ready                True    Wed, 28 Sep 2022 11:26:35 +0300   Mon, 26 Sep 2022 11:49:10 +0300   KubeletReady                 kubelet is posting ready status. AppArmor enabled
Addresses:
InternalIP:  10.116.0.4
Hostname:    basicnp-766qo
ExternalIP:  159.223.163.15
Capacity:
cpu:                4
ephemeral-storage:  165089200Ki
hugepages-1Gi:      0
hugepages-2Mi:      0
memory:             8149728Ki
pods:               110
Allocatable:
cpu:                3900m
ephemeral-storage:  152146206469
hugepages-1Gi:      0
hugepages-2Mi:      0
memory:             6694Mi
pods:               110
System Info:
Machine ID:                 a6b0d5360452428382d5b0c516caa546
System UUID:                a6b0d536-0452-4283-82d5-b0c516caa546
Boot ID:                    3345884c-f9af-4716-af86-17814d28ef96
Kernel Version:             5.10.0-0.bpo.15-amd64
OS Image:                   Debian GNU/Linux 10 (buster)
Operating System:           linux
Architecture:               amd64
Container Runtime Version:  containerd://1.4.13
Kubelet Version:            v1.24.4
Kube-Proxy Version:         v1.24.4
ProviderID:                   digitalocean://318312990
Non-terminated Pods:          (15 in total)
Namespace                   Name                                         CPU Requests  CPU Limits  Memory Requests  Memory Limits  Age
---------                   ----                                         ------------  ----------  ---------------  -------------  ---
cert-manager                cert-manager-ddd4d6ddf-zmpk4                 0 (0%)        0 (0%)      0 (0%)           0 (0%)         47h
ingress-nginx               ingress-nginx-controller-778667bc4b-7lj4c    100m (2%)     0 (0%)      90Mi (1%)        0 (0%)         47h
kube-system                 cilium-bv8x9                                 310m (7%)     100m (2%)   310Mi (4%)       75Mi (1%)      47h
kube-system                 cilium-operator-6d485f4f69-fsv7x             100m (2%)     0 (0%)      150M (2%)        150M (2%)      47h
kube-system                 coredns-9c8d9dc8c-9mzcd                      100m (2%)     0 (0%)      150M (2%)        150M (2%)      47h
kube-system                 cpc-bridge-proxy-dktvq                       100m (2%)     0 (0%)      75Mi (1%)        0 (0%)         47h
kube-system                 csi-do-node-trfdm                            0 (0%)        0 (0%)      0 (0%)           0 (0%)         47h
kube-system                 do-node-agent-vt9kn                          102m (2%)     102m (2%)   80Mi (1%)        300Mi (4%)     47h
kube-system                 konnectivity-agent-fnvp9                     0 (0%)        0 (0%)      0 (0%)           0 (0%)         47h
kube-system                 kube-proxy-9ff7c                             0 (0%)        0 (0%)      125Mi (1%)       0 (0%)         47h
microservices-demo-dev      cartservice-84758f76f-cl9vm                  200m (5%)     300m (7%)   128Mi (1%)       256Mi (3%)     45h
microservices-demo-dev      frontend-6d45d8cc5d-59fmw                    100m (2%)     200m (5%)   64Mi (0%)        128Mi (1%)     45h
microservices-demo-dev      productcatalogservice-556d4f9446-7sqp9       100m (2%)     200m (5%)   64Mi (0%)        128Mi (1%)     45h
microservices-demo-dev      recommendationservice-59f78c445b-5487v       100m (2%)     200m (5%)   220Mi (3%)       450Mi (6%)     45h
microservices-demo-dev      redis-cart-596c7658c4-lwf8g                  70m (1%)      125m (3%)   200Mi (2%)       256Mi (3%)     45h
Allocated resources:
(Total limits may be over 100 percent, i.e., overcommitted.)
Resource           Requests          Limits
--------           --------          ------
cpu                1382m (35%)       1227m (31%)
memory             1721869056 (24%)  1970381568 (28%)
ephemeral-storage  0 (0%)            0 (0%)
hugepages-1Gi      0 (0%)            0 (0%)
hugepages-2Mi      0 (0%)            0 (0%)
Installing the Kubernetes Dashboard
Note
The Kubernetes Dashboard is already available as a managed solution for DigitalOcean customers after creating a Kubernetes Cluster. You are installing it separately due to the lack of CPU and memory usage metrics not displayed in the managed solution and those metrics are very important to monitor. Please see this support case for more details.
In this section you will install the community maintained Kubernetes Dashboard. Please follow below steps to install it using kubectl:
-
Install the
Kubernetes Dashboardusingkubectl:kubectl apply -f https://raw.githubusercontent.com/kubernetes/dashboard/v2.6.1/aio/deploy/recommended.yamlNote
To check if the installation was successful, run the
kubectl get pods -n kubernetes-dashboardcommand, and confirm that the pods are running. -
In a new terminal window start the
kubectl proxy: -
Launch a web browser and open the Kubernetes Dashboard Login page. Then, choose the
Kubeconfigoption, and provide your cluster's config file to log in.Note
To get the config file navigate to your DigitalOcean cloud console, go to
Kubernetes, select your cluster and from theConfigurationsection, click onDownload Config File.After successfully logging in, you should be presented with the main dashboard landing page:
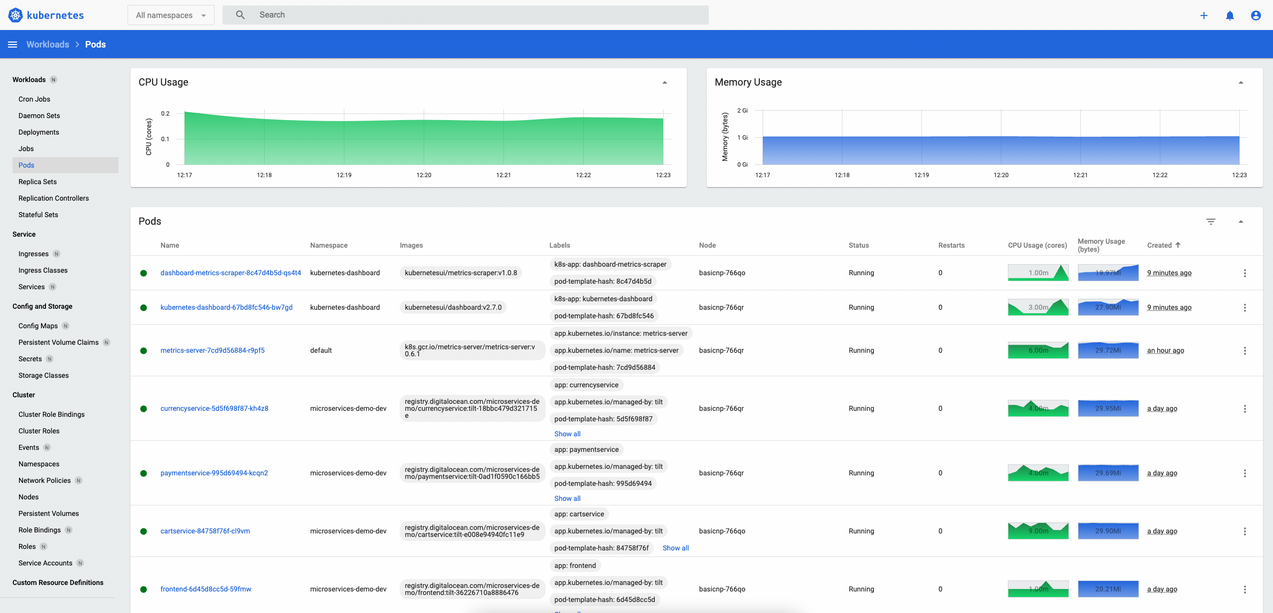
Next, you can check metric summaries for each pod, node, and namespace in your cluster. Editing Kubernetes objects is also possible, such as scaling up/down deployments, change image version for pods, etc.
Going further it is also possible to inspect log streams for pods. From the navigation bar at the top of the Pods view, click on the Logs tab to access a pod log stream directly in your web browser. In case of pods comprised of multiple containers, you have the option to inspect each container logs. Finally, you can Exec into a pod container from the same page.
Kuberentes events are also viewable from the Kubernetes Dashboard. From the left menu click on the Events view. Events will be displayed and stored for 1 hour.
Next, you will learn how to provision and configure the staging environment for the online boutique sample application. Besides DOKS setup and the sample app deployment, you will also configure a full observability stack comprised of logging, monitoring and alerting via Slack. Usually, a staging environment should be pretty close (if not similar) to a production environment.