Observability
Introduction
The goal of observability is to understand what’s happening across all of your environments and among the technologies, so you can detect and resolve issues to keep your systems efficient and reliable.
Observability is a measure of how well the system’s internal states can be inferred from knowledge of its external outputs. It uses the data and insights that monitoring produces to provide a holistic understanding of your system, including its health and performance. The observability of your system, then, depends partly on how well your monitoring metrics can interpret your system's performance indicators.
Prerequisites
To complete this section you will need:
- Helm installed as explained in the Installing required tools section.
- A Kubernetes cluster (DOKS) up and running as explained in the Set up DOKS section.
- The online boutique sample application deployed to your cluster as explained in the Deploying the app section.
- A DO Spaces bucket for
Lokistorage. Please follow the officialDigitalOceantutorial to create one. Make sure that it is set torestrict file listingfor security reasons.
Installing the Prometheus Monitoring Stack
-
Add the
Helmrepository and list the available charts: -
Install the
kube-prometheus-stack, usingHelm:HELM_CHART_VERSION="35.5.1" helm install kube-prom-stack prometheus-community/kube-prometheus-stack --version "${HELM_CHART_VERSION}" \ --namespace monitoring \ --create-namespace \ -f "docs/03-staging/assets/manifests/prom-stack-values-v${HELM_CHART_VERSION}.yaml"Note
A
specificversion for theHelmchart is used. In this case35.5.1was picked, which maps to the0.56.3version of the application. To check if the installation was successful, run thehelm ls -n monitoringcommand, and confirm the deployment status. -
Connect to
Grafana(using default credentials:admin/prom-operator) - by port forwarding to local machine:Info
You should NOT expose
Grafanatopublicnetwork (eg. you should create an ingress mapping orLBservice). -
Open a web browser and point to localhost:3000. You should see the
Grafnalogin page.Info
Grafanainstallation comes with a number of dashboards. Open a web browser on localhost:3000. Once in, you can go toDashboards -> Browse, and choose different dashboards. As an example, you can open theGeneral / Kubernetes / Compute Resources / Node (Pods)and view the resource metrics for a node and its related pods.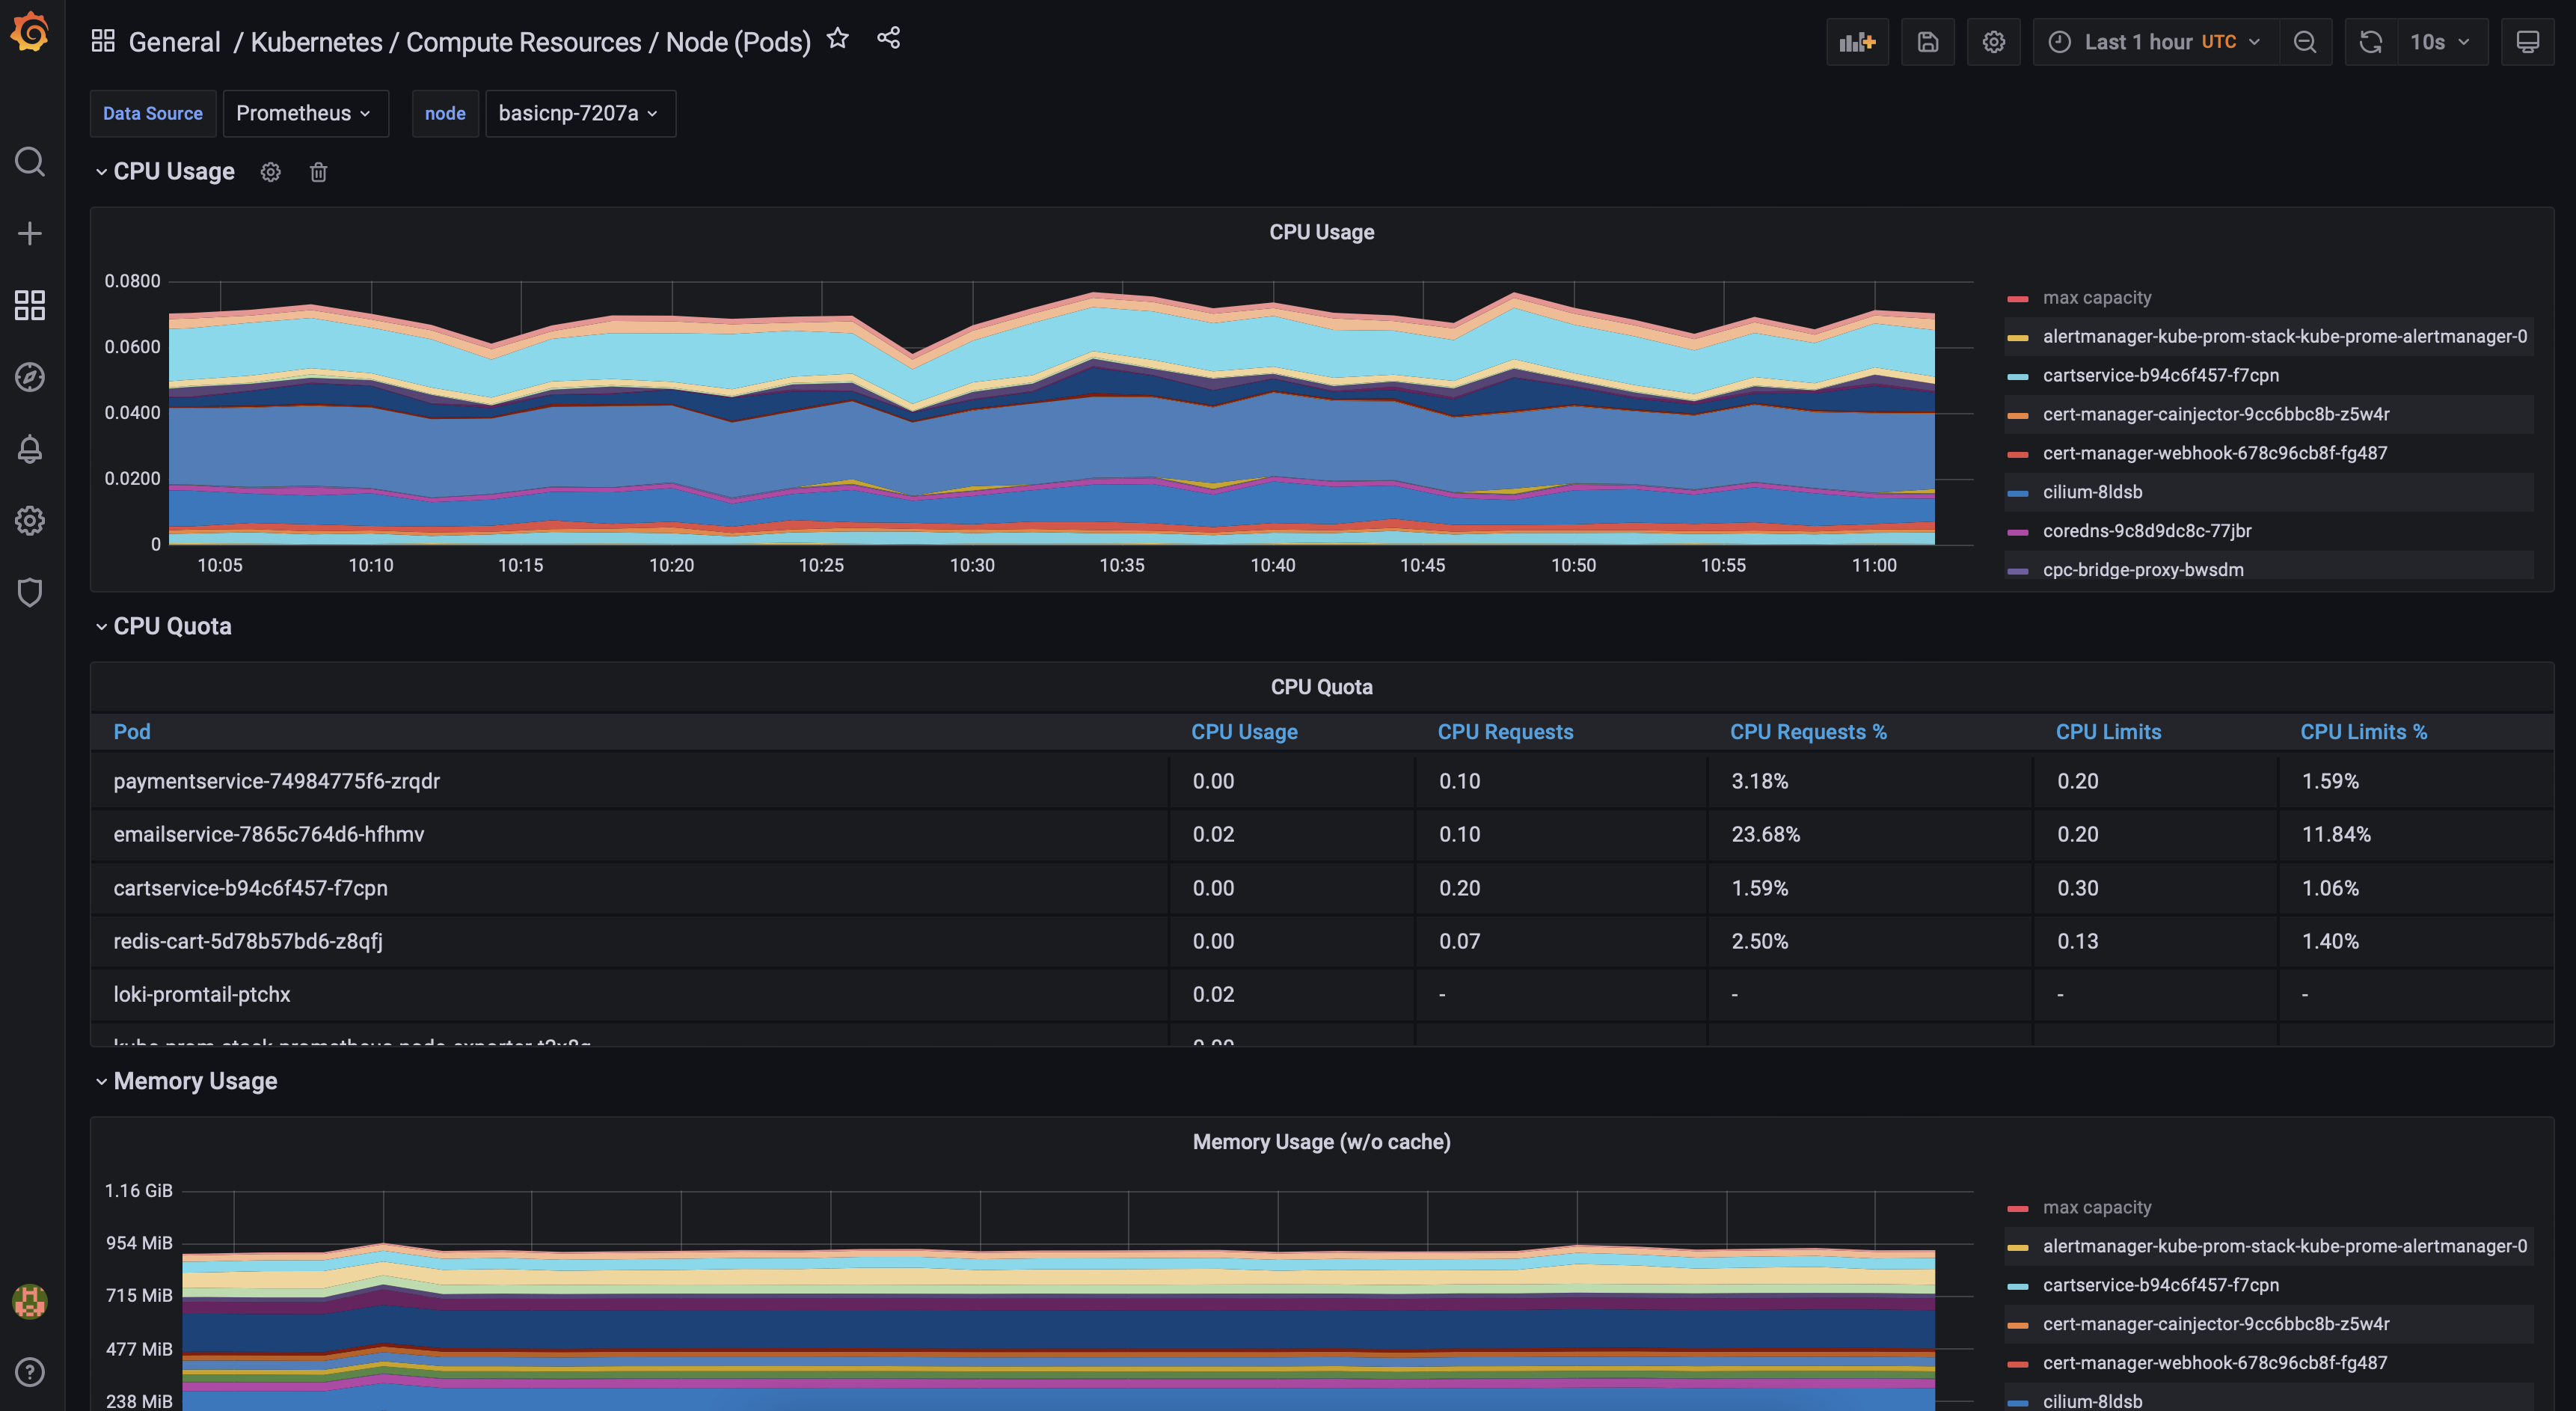
Configuring Persistent Storage for Prometheus
In this section, you will learn how to enable persistent storage for Prometheus, so that metrics data is persisted across server restarts, or in case of cluster failures. For the staging environment, you will define a 5 Gi Persistent Volume Claim (PVC), using the DigitalOcean Block Storage.
-
Open the
"docs/03-staging/assets/manifests/prom-stack-values-v35.5.1.yamlfile provided and uncomment thestorageSpecsection. The definition should look like this: -
Apply the new settings using
Helm:HELM_CHART_VERSION="35.5.1" helm upgrade kube-prom-stack prometheus-community/kube-prometheus-stack --version "${HELM_CHART_VERSION}" \ --namespace monitoring \ -f "docs/03-staging/assets/manifests/prom-stack-values-v${HELM_CHART_VERSION}.yaml"Note
Check the
PVCstatus by runningkubectl get pvc -n monitoring. A newVolumeshould appear in the Volumes web page, from yourDigitalOceanaccount panel.
Configuring Persistent Storage for Grafana
In this section, you will learn how to enable persistent storage for Grafana, so that metrics data is persisted across server restarts, or in case of cluster failures. For the staging environment, you will define a 5 Gi Persistent Volume Claim (PVC), using the DigitalOcean Block Storage.
-
Open the
docs/03-staging/assets/manifests/prom-stack-values-v35.5.1.yamlfile provided and uncomment thestorageSpecsection. The definition should look like this: -
Apply the new settings using
Helm:HELM_CHART_VERSION="35.5.1" helm upgrade kube-prom-stack prometheus-community/kube-prometheus-stack --version "${HELM_CHART_VERSION}" \ --namespace monitoring \ -f "docs/03-staging/assets/manifests/prom-stack-values-v${HELM_CHART_VERSION}.yaml"Note
Check the
PVCstatus by runningkubectl get pvc -n monitoring. A newVolumeshould appear in the Volumes web page, from yourDigitalOceanaccount panel.
Installing the Loki Stack
In this section you will learn about Loki, which is a log aggregation system inspired by Prometheus. Loki uses Promtail to fetch logs from all Pods running in your cluster. Then, logs are aggregated and compressed, and sent to the configured storage. Next, you can connect Loki data source to Grafana and view the logs.
-
Add the
GrafanaHelm repository and list the available charts: -
Intall the
Lokistack usingHelm:HELM_CHART_VERSION="2.6.4" helm install loki grafana/loki-stack --version "${HELM_CHART_VERSION}" \ --namespace=loki-stack \ --create-namespace \ -f "docs/03-staging/assets/manifests/loki-stack-values-v${HELM_CHART_VERSION}.yaml"Note
The above values file, enables
LokiandPromtailfor you, so no other input is required.PrometheusandGrafanainstallation is disabled, because Installing the Prometheus Monitoring Stack took care of it already. The2.6.4Helm chart version is picked forloki-stack, which maps to application version2.4.2. To check if the installation was successful, run thehelm ls -n loki-stackcommand, and confirm the deployment status.
Configuring Grafana with Loki
In this section, you will add the Loki data source to Grafana. First, you need to expose the Grafana web interface on your local machine (default credentials: admin/prom-operator):
Next, open a web browser on localhost:3000, and follow below steps:
- Click the
Configurationgear from the left panel. - Select
Data sources. - Click the
Add data sourceblue button. - Select
Lokifrom the list and addLokiurlhttp://loki.loki-stack:3100. - Save and test.
Info
If everything goes well, a green label message will appear, saying Data source connected and labels found.
You can access logs from the Explore tab of Grafana. Make sure to select Loki as the data source. Use the Help button for log search cheat sheet. !!! info As an example query, to retrieve all the logs for the microservices-demo-staging namespace you can run: {namespace="microservices-demo-staging"}.
Configuring Persistent Storage for Loki
In this step, you will learn how to enable persistent storage for Loki. You're going to use the DO Spaces bucket created in the Prerequisites section.
-
Open the
docs/03-staging/assets/manifests/loki-stack-values-v35.5.1.yamlfile provided and remove the comments surrounding theschema_configandstorage_configkeys. The definition should look like this:Click to expand the
loki configloki: enabled: true config: schema_config: configs: - from: "2020-10-24" store: boltdb-shipper object_store: aws schema: v11 index: prefix: index_ period: 24h storage_config: boltdb_shipper: active_index_directory: /data/loki/boltdb-shipper-active cache_location: /data/loki/boltdb-shipper-cache cache_ttl: 24h shared_store: aws aws: bucketnames: <YOUR_DO_SPACES_BUCKET_NAME_HERE> endpoint: <YOUR_DO_SPACES_BUCKET_ENDPOINT_HERE> # in the following format: <region>.digitaloceanspaces.com region: <YOUR_DO_SPACES_BUCKET_REGION_HERE> # short region name (e.g.: fra1) access_key_id: <YOUR_DO_SPACES_ACCESS_KEY_HERE> secret_access_key: <YOURDO_SPACES_SECRET_KEY_HERE> s3forcepathstyle: true -
Apply the new settings using
Helm:HELM_CHART_VERSION="2.6.4" helm upgrade loki grafana/loki-stack --version "${HELM_CHART_VERSION}" \ --namespace=loki-stack \ -f "docs/03-staging/assets/manifests/loki-stack-values-v${HELM_CHART_VERSION}.yaml"Note
Check if the main
Lokiapplication pod is up and running by runnging the followingkubectlcommand:kubectl get pods -n loki-stack -l app=loki. If everything goes well, you should see theDO Spacesbucket containing theindexandchunksfolders (thechunksfolder is calledfake, which is a strange name - this is by design, when not running inmulti-tenantmode).
Setting up a retention policy
In this step you will set up a retention policy for your DO Spaces bucket. S3CMD is a good utility to have in order to set up retention policies. Please follow the DigitalOcean guide for installing and setting up s3cmd.
-
Configure the
Lokibucket lifecycle, usings3cmd:Click to expand the
Loki bucket lifecycle<LifecycleConfiguration xmlns="http://s3.amazonaws.com/doc/2006-03-01/"> <Rule> <ID>Expire old fake data</ID> <Prefix>fake/</Prefix> <Status>Enabled</Status> <Expiration> <Days>10</Days> </Expiration> </Rule> <Rule> <ID>Expire old index data</ID> <Prefix>index/</Prefix> <Status>Enabled</Status> <Expiration> <Days>10</Days> </Expiration> </Rule> </LifecycleConfiguration> -
Check that the
policywas set (please replace the<>placeholders accordingly):Note
The
DO Spacesbackend implementation will clean the objects for youautomatically, based on the expiration date. You can always go back and edit the policy if needed later on, by uploading a new one.
Setting up Alert Manager
Alertmanager is deployed alongside Prometheus and forms the alerting layer of the kube-prom-stack. It handles alerts generated by Prometheus by deduplicating, grouping, and routing them to various integrations such as email, Slack or PagerDuty. Alerts and notifications are a critical part of your workflow. When things go wrong (e.g. any service is down, or a pod is crashing, etc.), you will want to get notifications in real time to handle critical situations as soon as possible.
To create a new alert, you need to add a new definition in the additionalPrometheusRules section from the kube-prom-stack Helm values file. You will be creating a sample alert that will trigger if the microservices-demo-staging namespace does not have an expected number of instances. The expected number of pods for the online boutique application is 10.
-
Open the
docs/03-staging/assets/manifests/prom-stack-values-v35.5.1.yamlfile provided and uncomment theadditionalPrometheusRulesMapblock. The definition should look like this:additionalPrometheusRulesMap: rule-name: groups: - name: online-boutique-instance-down rules: - alert: OnlineBoutiqueInstanceDown expr: sum(kube_pod_owner{namespace="microservices-demo-staging"}) by (namespace) < 10 for: 1m labels: severity: 'critical' annotations: description: ' The Number of pods from the namespace {{ $labels.namespace }} is lower than the expected 10. ' summary: 'Pod {{ $labels.pod }} down' -
Apply the new settings using
Helm:HELM_CHART_VERSION="35.5.1" helm upgrade kube-prom-stack prometheus-community/kube-prometheus-stack --version "${HELM_CHART_VERSION}" \ --namespace monitoring \ -f "docs/03-staging/assets/manifests/prom-stack-values-v${HELM_CHART_VERSION}.yaml"Info
To check that the alert has been created successfully, first port-forward to your local machine by running this command:
kubectl --namespace monitoring port-forward service/kube-prom-stack-kube-prome-prometheus 9090:9090. Navigate to the Promethes Console click on theAlertsmenu item and identify theOnlineBoutiqueInstanceDownalert. It should be visible at the bottom of the list.
Configuring Alertmanager to Send Notifications to Slack
To complete this section you need to have administrative rights over a workspace. This will enable you to create the incoming webhook you will need in the next steps. You will also need to create a channel where you would like to receive notifications from AlertManager.
Steps to follow:
- Open a web browser and navigate to
https://api.slack.com/appsand click on theCreate New Appbutton. - In the
Create an appwindow select theFrom scratchoption. Then, give your application a name and select the appropriate workspace. - From the
Basic Informationpage click on theIncoming Webhooksoption, turn it on and click on theAdd New Webhook to Workspacebutton at the bottom. - On the next page, use the
Search for a channel...drop-down list to select the desired channel where you want to send notifications. When ready, click on theAllowbutton. - Take note of the
Webhook URLvalue displayed on the page. You will be using it in the next section.
Next you will tell Alertmanager how to send Slack notifications.
-
Open the
docs/03-staging/assets/manifests/prom-stack-values-v35.5.1.yamlfile provided and uncomment thealertmanager.configblock. Make sure to update the<>placeholders accordingly. The definition should look like:Click to expand the
alertmanager configalertmanager: enabled: true config: global: resolve_timeout: 5m slack_api_url: "<YOUR_SLACK_APP_INCOMING_WEBHOOK_URL_HERE>" route: receiver: "null" repeat_interval: 12h routes: - receiver: "slack-notifications" matchers: - alertname="OnlineBoutiqueInstanceDown" continue: false receivers: - name: "null" - name: "slack-notifications" slack_configs: - channel: "#<YOUR_SLACK_CHANNEL_NAME_HERE>" send_resolved: true title: "{{ range .Alerts }}{{ .Annotations.summary }}\n{{ end }}" text: "{{ range .Alerts }}{{ .Annotations.description }}\n{{ end }}" -
Apply the new settings using
Helm:
!!! info At this point you should only receieve alerts from the matching OnlinqBoutiqueInstanceDown alertname. Since the continue is set to false Alertmanager will only send notifications from this alert and stop sending for others. Clicking on the notification name in Slack will open a web browser to an unreachable web page with the internal Kubernetes DNS of the Alertmanager pod. This is expected. For more information you can check out this article. For additional information about the configuration parameters for Alertmanager you can check out this doc. You can also at some notification examples in this article.
Setting up Event Exporter for events retention
A Kubernetes event is an object that shows what’s happening inside a cluster, node, pod, or container. These objects are usually generated in response to changes that occur inside your K8s system. The Kubernetes API Server enables all core components to create these events. Generally, each event is accompanied by a log message as well. Event objects are not regular log events, therefore the Kubernetes logs do not include them. Kubernetes has no builtin support to store or forward these events on the long term, and they are cleaned up after a short retention time defaulting to just 1 hour. In this section you will learn how to configure the Kubernetes Events Exporter and collect and perist those events using Loki.
-
Create the
ServiceAccount,ClusterRoleandClusterRoleBindingusingkubectl:The manifest file looks like the following:
Click to expand the manifest file
apiVersion: v1 kind: Namespace metadata: name: event-exporter --- apiVersion: v1 kind: ServiceAccount metadata: namespace: event-exporter name: event-exporter --- apiVersion: rbac.authorization.k8s.io/v1 kind: ClusterRoleBinding metadata: name: event-exporter roleRef: apiGroup: rbac.authorization.k8s.io kind: ClusterRole name: view subjects: - kind: ServiceAccount namespace: event-exporter name: event-exporter -
Create the
event exporterconfig usingkubectl:The manifest file for the config looks like the following:
Click to expand the config manifest file
-
Finally, create the
event exporterdeployment using kubectl:The manifest file for the deployment looks like the following:
Click to expand the deployment manifest file
apiVersion: apps/v1
kind: Deployment
metadata:
    name: event-exporter
    namespace: event-exporter
spec:
    replicas: 1
    template:
    metadata:
        labels:
        app: event-exporter
        version: v1
    spec:
        serviceAccountName: event-exporter
        containers:
        - name: event-exporter
            image: ghcr.io/resmoio/kubernetes-event-exporter:latest
            imagePullPolicy: IfNotPresent
            args:
            - -conf=/data/config.yaml
            volumeMounts:
            - mountPath: /data
                name: cfg
        volumes:
        - name: cfg
            configMap:
            name: event-exporter-cfg
    selector:
    matchLabels:
        app: event-exporter
        version: v1
Viewing events in Grafana
If the installation went well and no errors were reported you should start seeing event start to flow in Grafana.
-
Connect to
Grafana(using default credentials:admin/prom-operator) by port forwarding to local machine: -
Open a web browser on localhost:3000. Once in, you can go to
Exploremenu and select theLokias a datasource. -
In the
Log browserinput enter the following:Info
You should see events in the
Logssection. Any of the fields in theDetected fieldssection of a log detail view can be used to query. For example you can perform a query using the pod name and view specific logs for a certain pod:{app="event-exporter"} |= "shippingservice-79bdd5f858-gqm6g".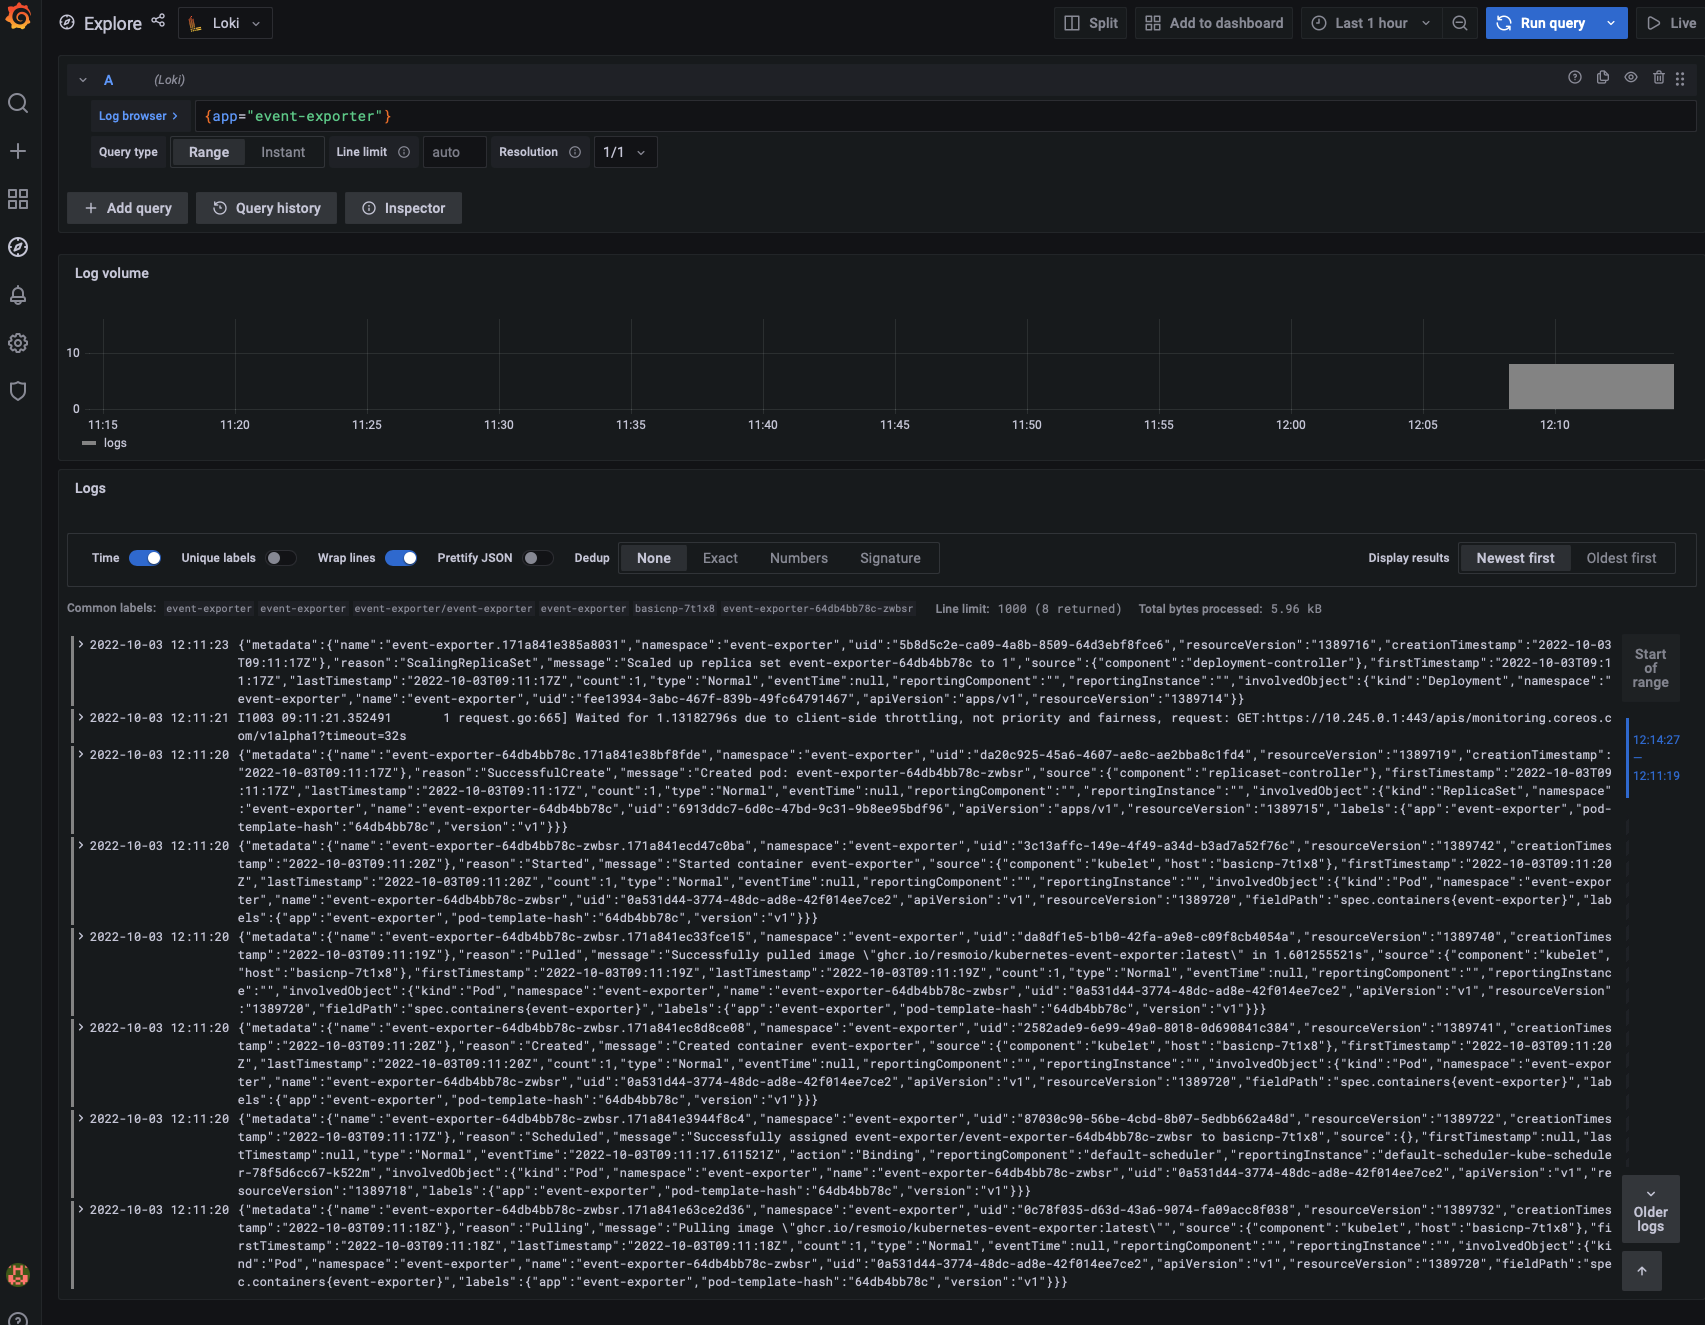
For a more in depth explanation on the Obervability topic you can check out the Kubernetes Starter Kit Tutorial.